Powered by Jupyter Book
import pandas as pd
import numpy as np
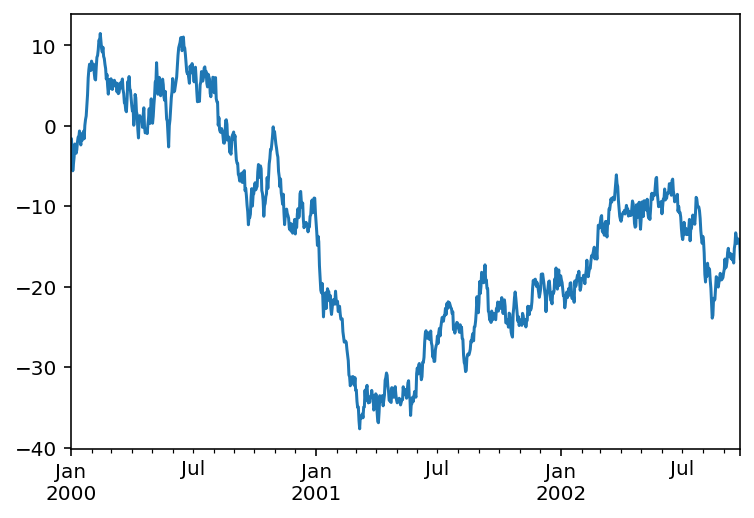
ts = pd.Series(np.random.randn(1000),
                index=pd.date_range('1/1/2000', periods=1000))


ts = ts.cumsum()

ts.plot()
<matplotlib.axes._subplots.AxesSubplot at 0x7f49b8893dd0>